Improved EM validation with Q-score
Starting September 23, wwPDB validation of 3DEM structures for which there is both a model and an EM volume will include the Q-score metric (Pintilie, G., et al., 2020, Nat. Methods). This follows recommendations from the wwPDB/EMDB workshop on cryo-EM data management, deposition and validation in 2020 (white paper in preparation), as well as EM Validation Challenge events (Lawson C., et al., 2020, Struct. Dyn.; Lawson, et al., 2021, Nat. Methods). This will be the first quantitative parameter of residue and chain resolvability for EM maps in wwPDB validation reports and will provide an additional map-model assessment criterion.
The Q-score calculates the resolvability of atoms by measuring similarity of the map values around each atom relative to a Gaussian-like function for a well resolved atom. Q-score of 1 indicates that the similarity is perfect whilst closer to 0 indicates the similarity is low. If the atom is not well placed in the map then a negative Q-score value may be reported. Therefore, Q-score values in the reports will be in a range of -1 to +1.
The wwPDB EM validation reports will provide Q-scores for single particle, helical reconstruction, electron crystallography and subtomogram averaging entries for which both an EM map and coordinate model have been deposited.
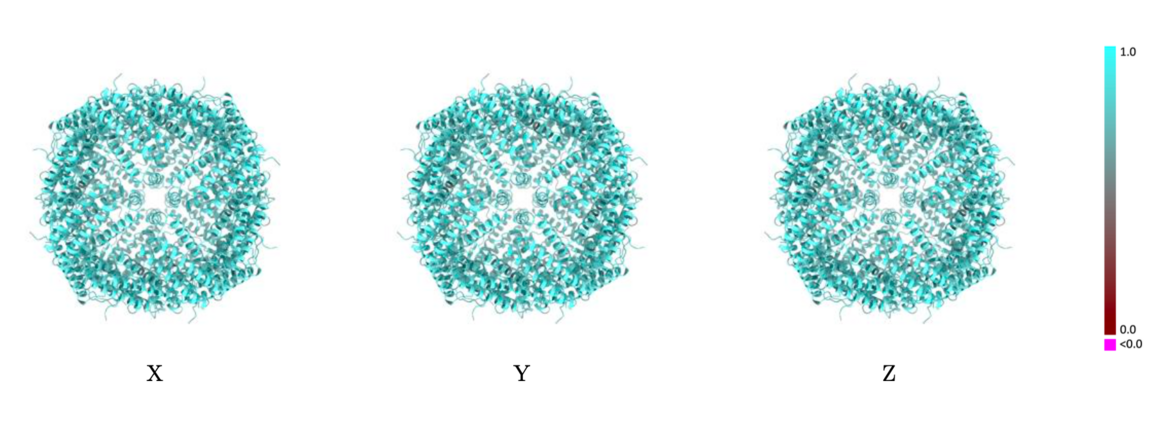
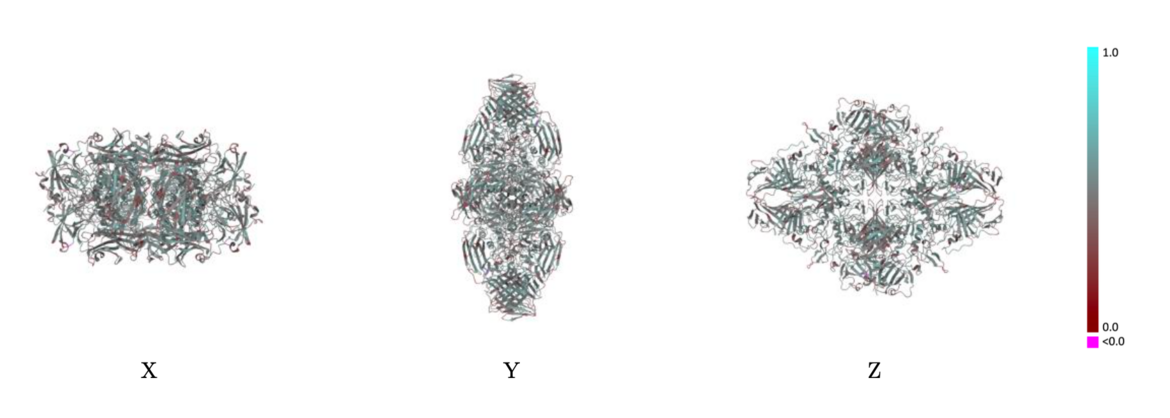
Validation reports (PDF files) will contain images of the average per-residue Q-scores color-mapped onto ribbon models with views from three orthogonal directions. Similar images will also be introduced to visualize the per-residue atom-inclusion scores. Comparison of these two sets of images will assist in visual assessment of the model-to-map fit and quality.
The images below show the model with each residue colored according to its Q-score.
 Example showing mostly cyan colors indicating Q-score closer to 1 and a good resolvability of atoms
 Example showing mostly red colors indicating Q-score closer to 0 and not a good resolvability of atoms
The validation reports will also contain a table of average per-chain values of both metrics (Q-score and atom inclusion) as well as their overall average values for the entire model.
The per-residue and the per-chain average atom-inclusion and Q-score values will also be provided in the mmCIF and XML formatted validation files. The mmCIF categories _pdbx_vrpt_summary_entity_fit_to_map and _pdbx_vrpt_model_instance_map_fitting will be introduced to include both the Q-scores and atom-inclusion values. The existing items, _pdbx_vrpt_summary_entity_geometry.average_residue_inclusion and _pdbx_vrpt_model_instance_geometry.residue_inclusion for atom inclusion will no longer be used.
The PDB Core Archive holds validation reports that assess each 3DEM model in the PDB along with the associated experimental 3D volume in EMDB. Validation reports of 3DEM structures (map and model) can be downloaded at the following wwPDB mirrors:
- wwPDB: https://ftp.wwpdb.org/pub/pdb/validation_reports/
- RCSB PDB: https://ftp.rcsb.org/pub/pdb/validation_reports/
- PDBe: https://ftp.ebi.ac.uk/pub/databases/pdb/validation_reports/
- PDBj: https://ftp.pdbj.org/pub/pdb/validation_reports/
The EMDB Core Archive holds validation reports that assess each EMDB map/tomogram entry. Validation reports for all EMDB volumes can be downloaded at the following wwPDB mirrors:
- EMDB: https://ftp.ebi.ac.uk/pub/databases/emdb/validation_reports/
- wwPDB: https://ftp.wwpdb.org/pub/emdb/validation_reports/
- RCSB PDB: https://ftp.rcsb.org/pub/emdb/validation_reports/
- PDBj: https://ftp.pdbj.org/pub/emdb/validation_reports/
Additional information about validation reports is available for EM map+model, EM map-only, and EM tomograms.
If you have any questions or queries about wwPDB validation, please contact validation@mail.wwpdb.org.
Source: wwPDB News, July 25, 2022